This is the first of a series of posts detailing the planning, installation, setup, and performance data of a residential solar system with battery backup. While there are options to lease a solar installation, this will only cover ownership. This first post will focus on the background economics.
It’s the Economy, Stupid
Fancy electronics do not come cheap, especially if you don’t want them to burn down your house. Batteries can also be expensive. NREL finds that the price per watt of installed residential solar as of 2023 is about $2.7/W, down significantly from $8.6/W in 2010.1 Consumer Reports finds on average for 2025 a comparable $2.8/W, with some variation from state to state.2 This is on average of course, with labor and energy storage possibly making significant changes.
Rebates and more
There are several obvious, and some not obvious upsides though. The biggest ones are rebates and tax credits from local, state, and federal sources. The federal solar tax credit offered a %30 credit to your income taxes based off the price of installation of a new solar system, including materials and installation costs. However, this was axed earlier than originally planned and only systems put into service by the end of 2025 will qualify. Many state and local rebates programs remain however to still assist people in installing a system. Moving past one time upsides to recurring, a lesser known income stream from solar panels is that you can be issued Solar Renewable Energy Credits (SRECs) based on the amount of energy you produce. You can then sell these SRECs on the open market like other securities. If you have a fully electrified home and transportation, you could also harvest enough energy to not need any from your local grid, about 875 kWh monthly, which comes out to about $139 you could save.34 There also some grid companies that will let you sell back more than you use allowing you to generate income instead of just breaking even. A detail that can compound over time though is that when you pay your electric bill, you are paying two major charges: the generation charge, and the distribution charge. Typically, when you export to grid, you will only be getting credited for the generation charge. Thus, if you are interested in minimizing expenses and maximizing cash flow, it is wise to have an energy storage system installed that can take your surplus power first, so you can then power loads when the available power from the panels is insufficient. This way you can avoid the distribution charge from importing power from the grid, and when your energy storage system is full you can export the excess for profit.
Batteries et al.
Energy Storage Systems (ESS), can come in a myriad of forms, but can be generally divided into Chemical, Mechanical, and Electrical. Chemical storage is the reverse of what you would typically expect using fuel, but for example it is possible through electrolysis to generate Hydrogen gas out of electricity which can be stored and burned later. Mechanical storage relies on methods such as change of inertia for high mass flywheels, common for backup generator switchover systems, and change in potential energy, such as pumped storage hydroelectricity. Electric storage is the purest solution, using either capacitors or batteries to store the charge for later use. Due to size, permitting, and construction requirements, I am unaware of any off the shelf high mass flywheels or pumped storage systems for residential use, though for larger ranches with appropriate terrain micro-hydro power looks to be a straight forward project. As a result, the only real contender in the residential ESS space is batteries, which have decreased over time to under $100/kWh for cell cost, but when buying finished, UL listed batteries the price increases to $750/kWh.56
Payback time
No, not for your bullies. Like any big investment you make, you should look at the payback period, that is how long it will take for savings or profit to balance out the upfront cost. Start with your total available roof space and solar generation capacity, there are many calculators out there such as Google’s Project Sunroof.7 Look at your energy bills and see how much electricity you are using yearly to calculate cost and how much generation capacity you would need to meet your needs. Use your daily average to calculate the sizing for your onsite ESS. With all these numbers you should be able to calculate a rough up front cost, along with annual savings. Divide the two and that is your payback period. Don’t be shocked if it is in years, large power plants payback periods are often measured in decades.8
Example
First, see how much sun we get yearly and an estimate of roof space. Higher efficiency panels can generate over 20W/sq foot, but we’ll assume 15W/sq foot for this.
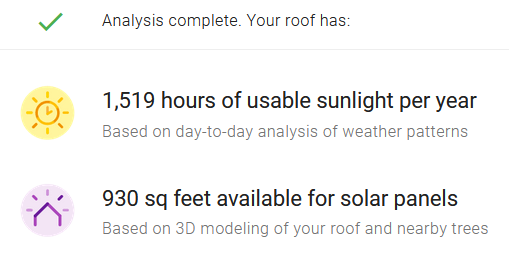
With 930 square feet at 15W/sq foot, a rough estimate is a max array size of 14 kW. Multiply by our sunshine time of 1519 hours, we get annual generation of just over 21,000 kWh. Now lets see how that compares to usage.
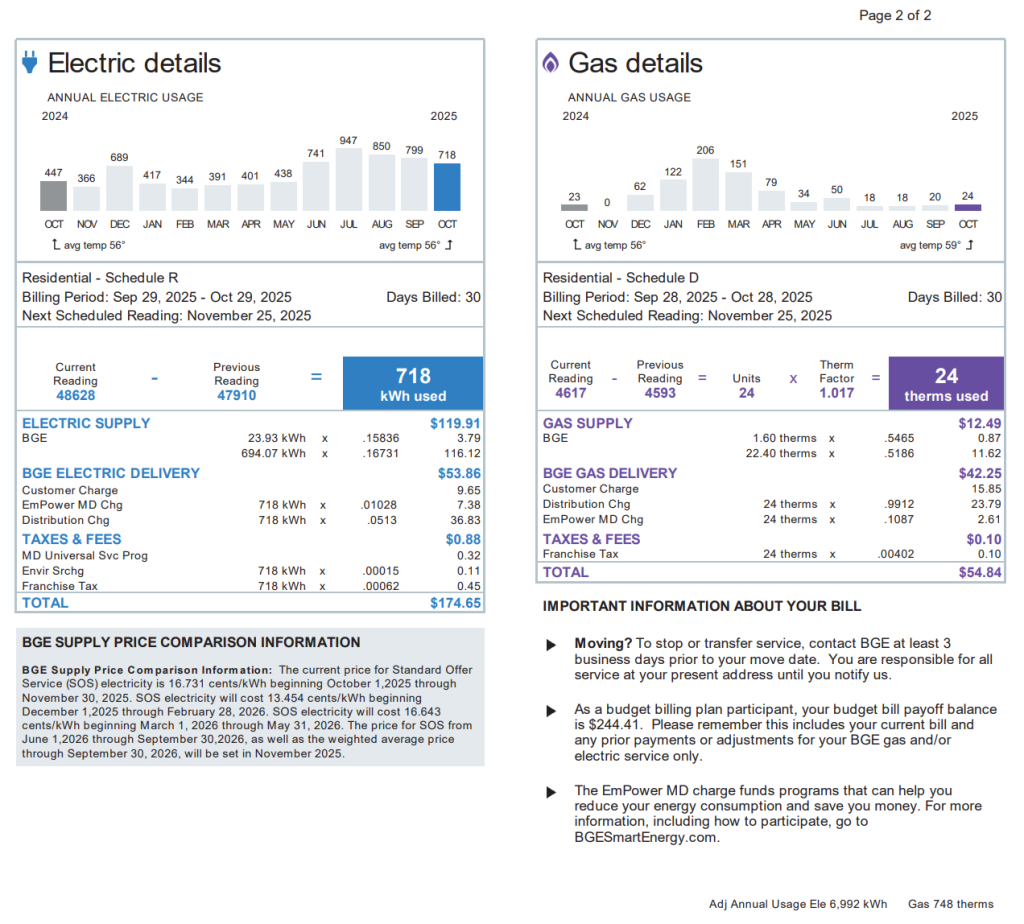
This is from my BGE bill and it has lots of good information, including the generation cost and the distribution cost per kWh so you can calculate savings later. For now we’re looking at the bottom right where it gives the annual usage of just under 7,000 kWh. A generation capacity of three times the usage, sounds great, but unless your grid is willing to take the excess it is wasted capacity. BGE for instance will only purchase up to 200% of excess based on my annual usage. Looking at daily usage, the annual high was July with 947 kWh used, divided by nominal 30 day month that comes to just under 32 kWh per day. It is good practice to only discharge Lithium Ion type batteries, the most common residential ESS solution, to 20% discharge. To find a one day power backup we’ll divide 32/(1-.2)=40 kWh. The battery can be sized smaller than this if you only need to run overnight and have rare clouds, or could be larger if you have long nights and dreary days. If you find your grid can be unstable at times a larger battery backup could also be beneficial, though many systems allow you to tie in a traditional generator to recharge batteries in a power outage scenario.
Let’s assume a 14kW system with a 40kWh battery. 14kW at $2.7/W is just under $38K, while $750/kWh for a 40kWh battery is $30K. Total sticker price: $68K. Ouch. Let’s take some rebates out: 30% Federal rebate is $21K, Maryland Solar grant is $7K, Maryland ESS grant is $5K, county property tax is $1K, total of $34K, which is half our project cost. For energy savings, total electricity cost per kWh is just under 23 cents. Multiplied by 7MWh annual usage that comes out to $1.6K yearly. The remaining 14MWh of generation is paid out at the SOS rate of 16.731 cents/kWh, which comes to $2.3K yearly. You also get one SREC per MWh of generation, so the 14kW array will generate 21 SRECs annually, the current bid price each being $52, adding $1.1K yearly. Total annual savings and income: $5K. Dividing the after rebates price of $34K by annual savings and income of $5K gives a payback period of 6.8 years. Considering the panels and batteries have warranties that can be as long as 20 years, this system could make a 3x return on initial investment over its lifetime.
Sources
- Solar Installed System Cost Analysis | Solar Market Research & Analysis | NREL ↩︎
- How Much Do Solar Panels Cost? (Nov 2025) ↩︎
- Electricity use in homes – U.S. Energy Information Administration (EIA) ↩︎
- Electricity Rates by State (November 2025) ↩︎
- Lithium ion battery cell price ↩︎
- Solar Battery Cost: Is It Worth It? (2025) | ConsumerAffairs® ↩︎
- Project Sunroof ↩︎
- Energy Return on Investment – World Nuclear Association ↩︎
Leave a Reply